概述
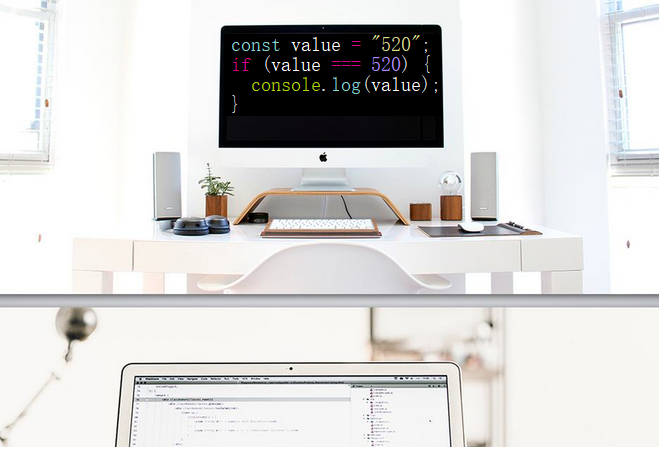
我们之道作为一个码农,不论其实现如何,功能怎样,写的一手清晰靠谱的代码是其代码功力的体现。好的、清洁的代码可以方便自己以后维护,让你的继任者马上能接手维护它,而不是给你檫屁股,被人戳脊梁骨、被骂垃圾代码。所以,写清洁代码非常重要。
继续阅读我们之道作为一个码农,不论其实现如何,功能怎样,写的一手清晰靠谱的代码是其代码功力的体现。好的、清洁的代码可以方便自己以后维护,让你的继任者马上能接手维护它,而不是给你檫屁股,被人戳脊梁骨、被骂垃圾代码。所以,写清洁代码非常重要。
继续阅读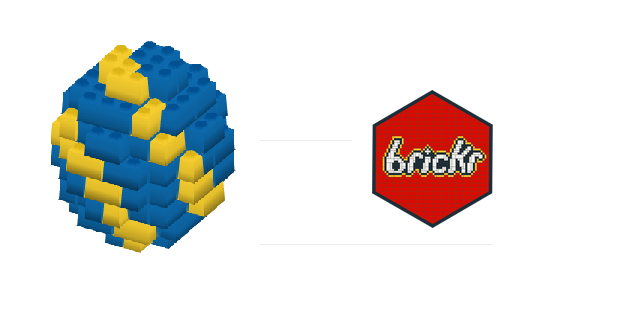
很多人喜欢乐高积木,但是苦于囊中羞涩,媳妇不给钱买,怎么办呢?不要愁!虫虫今天给大家介绍一个很有意思的项目brickr,利用它我们可以利用R语言编程来玩乐高积木,学习游戏两不误,何乐而不为呢?
brickr是基于R tidyverse和rayshader包来创建LEGO 2D和3D模型的工具包。利用它我们可以:
将图像文件转换为2D和3D LEGO马赛克
从简单的数据框架构建3D乐高模型
继续阅读大家都知道麻省理工MIT是世界数一数二的大学,更是计算机技术科学界的翘楚。去年麻省理工又投资十亿美刀建立苏世民(Stephen A. Schwarzman)计算机学院。在最近院庆活动中,麻省了推出了其CS科技成果展,罗列了一些了伟大的发明包括了数字电路到可可消化胶囊肠壁治疗机器人。本文虫虫和大家一起来看看麻省这些改变世界的伟大发明。
继续阅读Perl6的开发如何做到自动化?其实很简单,只需要一个应用Tomtit。
Tomtit是一个全新的Perl6任务运行器,可让你很便捷地自动执行日常任务。
本文中,我们将展示如何使用Tomtit实现Perl6开发自动化,我们以实例展示Perl6开发中的典型场景:设置git存储库、测试本地源代码、安装本地源代码、发布CPAN模块。关于Tomtit的详细介绍请参考文章(https://dev.to/melezhik/one-tomtit-for-it–1j3f)。
继续阅读
Tomtit是基于Perl6语言开发的任务执行器,它方便好用、任务定义快捷简洁,内置数十个常用场景任务插件,利用该雀儿帮我们自动化Perl/Perl6以及更多的语言开发任务。
继续阅读SSH全称secure shell,是一种网络传输协议,是最常用的安全管理远程服务器的协议和工具集。SSH协议中使用多种加密技术保证在用户终端和服务器之间建立加密安全连接,连接双方通过互相握手验证,并通过加密的通道传递管理命令和执行结果。
本文中,虫虫将以此为话题和大家一起学习下SSH协议中涉及的基础加密技术以及怎么利用这些技术构建安全的通讯。此信息可用于了解各种常见的加密技术,SSH加密层、安全连接构建步骤以及双方互相验证步骤能内容。
继续阅读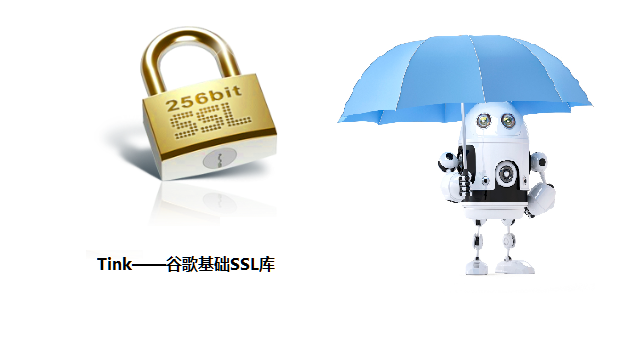
要说一个软件对IT和互联网业界影响力,恐怕OpenSS要算上一个。一个甚至主要版本使用版本还不到V1.2的软件,占据了整改互联网底层安全核心。SSH、HTTPS,还有其他很多的基础加密库都是离不开OpenSSL的。
继续阅读命令行是一个强大的工具,而我们大多数却都不会用,可以说没有命令行的世界等于你失去了一多半的乐趣和技能。
本文虫虫和大家一起来聊聊命令行,并教大家一起来学习命令,不管你是运维、开发、测试、DBA,甚至是项目经理、PM都能通过命令行获得很大的裨益。当然我们主要是以开发了主要受众来举例子说明。
继续阅读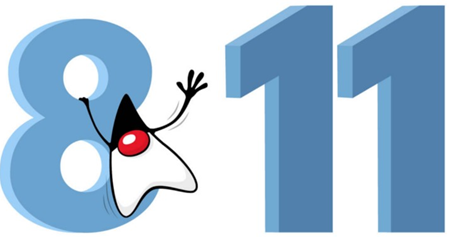
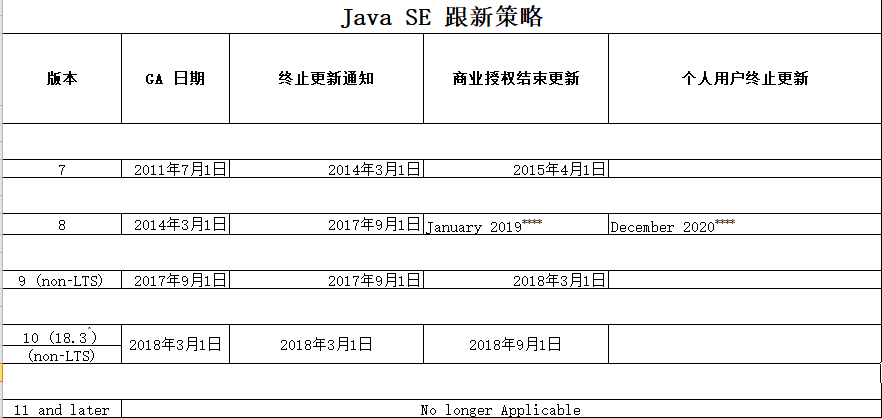
Oracle JDK 8将于2019年1月(从现在起153天)停止发布公共更新,时间不多了,所以虫虫认为现在是最好的时机迁移到最新版JDK版本,享受新版本的各种黑魔法和新功能了。
继续阅读“为什么你会想要使用ASP.NET,还活90年代?”,几年前,当我提出考虑要在一个项目中使用ASP.NET时候,我的一位老同事的回应。当时我很大程度上认同他的看法。微软雇佣了一个伟大的程序员,开发了一个伟大的语言,创建了一个伟大的Web框架和IDE工具,但人们仍然不太满意。那次我们最终没有为该项目使用ASP.NET的主要原因是因为语言和框架的封闭模式。使用ASP.NET意味着为我们的服务器必须支付Windows服务器许可证费用,或者为了让我们的C#应用程序跑在Linux上,我们就必须的使用Mono,一个漏洞百出,需要填很多的坑的不成熟的玩具。
继续阅读